Losing a portable restroom to a massive, sprawling construction site is a direct hit to your bottom line. Operators relying on whiteboards and memory frequently misplace inventory, leading to missed billing cycles and thousands of dollars in lost capital. DispatchNode completely eliminates lost assets by providing a unified digital ledger that tracks the exact GPS location, service history, and billing status of every single unit in your fleet.
The Myth of Manual Inventory
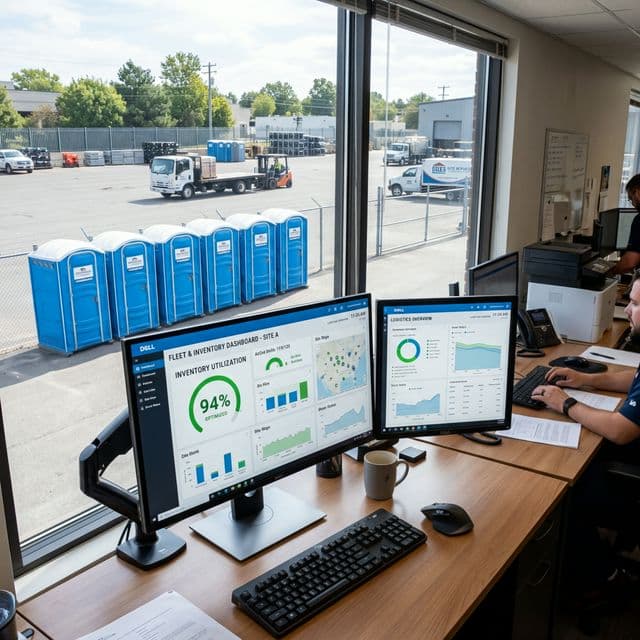
Managing a fleet of five hundred portable toilets using spreadsheets and sticky notes guarantees operational failure. DispatchNode assigns a unique digital identifier to every physical asset, creating a centralized, real-time database that shows exactly how many units are in the yard, how many are deployed, and precisely where each deployed unit is located on a live satellite map.
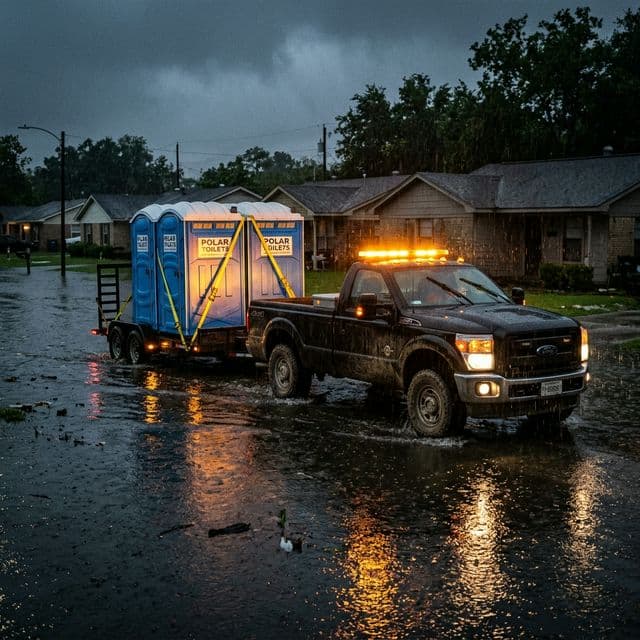
When a sanitation company relies on manual tracking, inventory numbers are constantly inaccurate. A driver might move a unit from one side of a commercial development to another at the request of a foreman without notifying the dispatcher. When the service truck arrives the following week, the unit is "missing." The driver wastes an hour searching for it, destroying the profitability of the entire route.
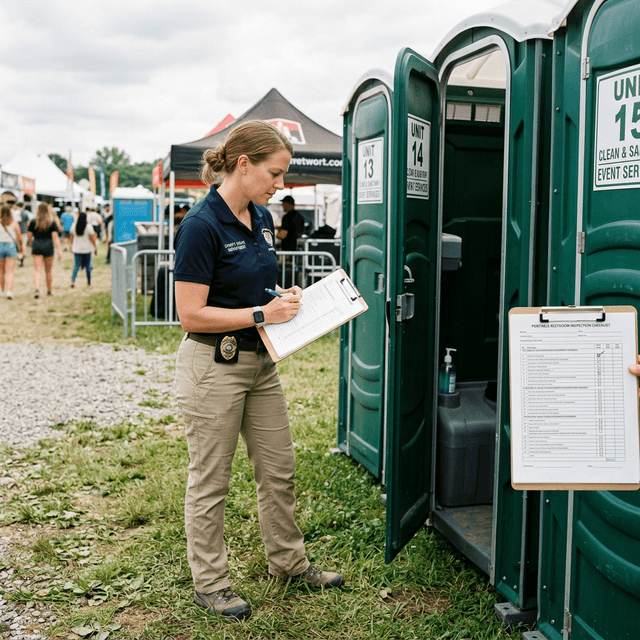
The digital ledger eliminates this chaos. Every time a driver drops, services, or moves a unit, they scan a barcode or RFID tag using the mobile application. This action instantly updates the unit's GPS coordinates in the central database. The dispatcher can view the entire fleet on a live map, filtering by status (Deployed, Available, Damaged, In-Transit) to gain total operational awareness at a glance.
This real-time visibility is important for capturing sudden revenue opportunities. If a frantic event planner calls needing twenty units immediately, a dispatcher relying on a whiteboard must call multiple drivers to estimate yard inventory. With the AI platform, the dispatcher instantly sees exactly how many clean units are available in the yard, allowing them to secure the high-margin emergency contract while competitors are still trying to count their stock.
Maximizing Asset Utilization
A portable toilet sitting idle in the yard is a depreciating liability. DispatchNode tracks the utilization rate of every asset category, highlighting exactly which units are generating revenue and which are sitting stagnant, allowing operators to make highly accurate, data-driven decisions regarding inventory purchases and fleet expansion.
Asset utilization is the defining metric of profitability in the rental industry. If an operator owns one hundred standard units and eighty are consistently deployed, the utilization rate is a healthy eighty percent. However, if they own twenty luxury restroom trailers and only two are deployed, they are bleeding capital on underperforming assets. The dashboard tracks these metrics continuously, providing a clear visual breakdown of fleet performance.
The AI leverages this historical utilization data to forecast future inventory needs. By analyzing seasonal trends—such as the massive spike in demand during summer construction and festival seasons—the software predicts exactly when the fleet will reach maximum capacity. This allows the business owner to order new units months in advance, avoiding the frantic, highly expensive rush to secure inventory at the start of peak season.
Furthermore, the system prevents the over-purchasing of specialized units. Operators frequently buy too many ADA-compliant or high-rise sling units based on a single large contract. The utilization dashboard reveals exactly how often these specialized units are requested across the entire customer base, ensuring that capital is allocated toward the standard units that drive the vast majority of recurring monthly revenue.
Preventing Lost and Stolen Units
Construction sites are chaotic environments where expensive equipment routinely vanishes. DispatchNode combats inventory shrinkage by generating automated alerts if a deployed unit is not serviced or scanned within its scheduled timeframe, instantly flagging the asset as potentially missing and dispatching a recovery driver before the trail goes cold.
Theft and abandonment are massive hidden costs in the portable sanitation industry. General contractors occasionally move units off-site to secondary projects without notifying the provider. By the time the operator realizes the unit is gone, the contractor has demobilized, and the asset is lost forever. The digital ledger prevents this by enforcing strict service verification scans.
If a weekly service route is completed and a specific unit was not scanned, the system immediately alerts management. The dispatcher can view the last known GPS coordinates and contact the site superintendent immediately to demand the return of the unit. This rapid response completely neutralizes the "we don't know where it went" excuse frequently used by disorganized contractors.
For highly expensive assets, such as luxury restroom trailers, the platform integrates smoothly with hardwired GPS telematics devices. The software tracks the trailer's location in real-time, regardless of whether a driver has scanned it. If a trailer is moved outside of a predefined geofence during unauthorized hours, the system triggers an immediate security alert, allowing the operator to coordinate a rapid recovery with local law enforcement.
Automated Billing Reconciliation
Tracking physical location is only half the battle; tracking the financial status of every unit is what drives cash flow. DispatchNode automatically links the physical location of a unit to the active billing contract, ensuring that every deployed unit is actively generating revenue and preventing operators from providing free sanitation services to expired accounts.
A common failure point in manual operations is the disconnect between dispatch and accounting. A contract ends, but the retrieval order gets lost on the dispatcher's desk. The unit sits on the site for an extra month, being serviced by a driver who is blindly following their route sheet, while the accounting department has stopped invoicing the client. This results in massive financial losses.
The integrated software eliminates this disconnect completely. The physical status of the unit is irrevocably tied to the digital contract. When a contract expires or a payment fails, the system automatically removes the unit from the recurring service route and generates an urgent retrieval work order. The driver cannot service the unit; they are explicitly instructed by the app to load it onto the truck and return it to the yard.
By bridging the gap between physical inventory tracking and automated billing, the platform ensures that operators are paid for every single drop, pump, and pickup. It transforms a chaotic yard of plastic units into a highly organized, heavily monetized fleet of digital assets, delivering unprecedented financial control to the business owner and guaranteeing maximum profitability across the entire operation.
Key Utilization Metrics to Track
Maximizing portable toilet fleet profitability requires tracking metrics that go beyond simple unit counts. The most profitable operators monitor utilization rates, revenue per unit, and idle time to make data-driven deployment decisions.
Total fleet utilization rate measures the percentage of owned units actively deployed at any given time. A healthy utilization rate is 75-85%. Below 70% indicates excess inventory. Above 90% indicates insufficient capacity to absorb emergency requests. Revenue per unit per month should be tracked individually, as units deployed to high-margin event rentals generate 3-5x the revenue of units on long-term construction contracts.
The SBA (Small Business Administration) recommends that asset-heavy service businesses maintain a detailed inventory utilization dashboard to identify underperforming assets and inform capital expenditure decisions.
Inventory Lifecycle Management
Every portable toilet has a finite economic lifespan. Tracking lifecycle data prevents deploying units that are beyond their useful life:
- Age Tracking: Log the purchase date and total deployment months for every unit. Standard polyethylene units have a useful life of 8-12 years depending on climate exposure.
- Condition Scoring: Rate each unit on a 1-5 scale after every servicing visit. Units consistently scoring below 3 should be flagged for retirement.
- Repair History: Track cumulative repair costs per unit. When repair costs exceed 40% of replacement cost, the unit should be retired.
- Depreciation Schedule: Use straight-line depreciation over the unit's expected lifespan for accurate financial reporting and tax planning.
- Disposal Compliance: Retired units must be disposed of through approved channels. Many municipalities classify portable toilet waste systems as regulated material.
For more on fleet operations, read our guide on Fleet Management for Portable Toilet Operators.
Quick Reference Data
| Utilization Range | Status | Action Required |
|---|---|---|
| 90-100% | Over-Capacity | Purchase additional units immediately |
| 75-90% | Optimal | Monitor and maintain |
| 60-75% | Under-Utilized | Increase sales outreach |
| Below 60% | Excess Inventory | Sell or retire underperforming units |
Tracking Asset Depreciation and Lifecycle Velocity
A portable toilet is a depreciating capital asset, and tracking its utilization is not merely an operational exercise; it is the foundation of the company's financial accounting and capital expenditure strategy. Treating a fleet of five hundred units as a single, homogenous block of plastic ignores the reality that each unit degrades at a different rate based on its specific deployment history.
Advanced inventory tracking systems assign a unique digital identity to every asset in the fleet, typically linked via a durable QR code or RFID tag. The software records the precise date of acquisition, the manufacturer, the purchase price, and the exact model specification. From that moment forward, the system tracks every day the unit spends deployed in the field versus sitting idle in the yard.
This granular data allows the software to calculate a dynamic depreciation curve for each specific unit. A toilet deployed year-round to harsh, high-UV environments in the Southwest will experience accelerated plastic degradation compared to a unit in the Northeast that spends four months of the winter in indoor storage. The system tracks this "environmental wear factor," combining it with the frequency of service events (which indicates usage intensity) to predict the asset's true remaining useful life.
When it is time for the annual capital budgeting process, the operator does not have to guess how many units need replacing. The software generates a predictive replacement schedule, identifying exactly which serial numbers have reached the end of their economic viability based on maintenance history and physical degradation. This data-driven approach prevents the operator from prematurely retiring viable assets or, conversely, continuing to deploy heavily degraded units that damage the brand's reputation and incur excessive maintenance costs.
Real-Time Inventory Visibility and Yield Management
The inability to accurately answer the question "How many units do we have available right now?" is a fatal flaw that paralyzes the sales process and destroys revenue potential. In a manual system, determining available inventory requires a dispatcher to physically walk the yard counting units, and then attempt to cross-reference that count against a whiteboard listing upcoming deliveries and removals. This process is inherently inaccurate and completely collapses during peak season.
Modern dispatch platforms provide absolute, real-time inventory visibility through continuous state tracking. Every unit in the database exists in one of four states: Available (clean and in the yard), Deployed (on a customer site), Scheduled (committed to an upcoming order but still in the yard), or Maintenance (damaged or requiring deep cleaning). The system updates these states instantaneously as drivers complete actions on their mobile apps.
This real-time visibility is the prerequisite for implementing airline-style yield management pricing. When the system detects that "Available" inventory for a specific unit class (such as luxury restroom trailers) has dropped below fifteen percent for a specific upcoming weekend, it automatically triggers surge pricing algorithms. The price for remaining units increases to reflect the scarcity of the asset.
Conversely, if the system projects a massive surplus of standard construction units entering the yard over the next thirty days due to several large projects wrapping up simultaneously, it can alert the sales team to offer promotional pricing to secure new long-term contracts. This algorithmic yield management ensures the operator maximizes the revenue potential of every single asset, aggressively capturing premium margins during demand spikes while preventing inventory from sitting idle and generating zero return on investment.
The intersection of inventory tracking and theft prevention is a critical operational requirement, particularly in markets with high rates of construction site vandalism. Portable toilets, despite their size, are frequently stolen or illicitly relocated by unscrupulous contractors trying to avoid rental fees. Traditional tracking relies on the driver noticing the unit is missing during a scheduled service visit, which could be days or weeks after the theft occurred. Advanced operators deploy discreet, battery-powered IoT trackers hidden within the structural framing of their premium assets, such as luxury trailers and ADA-compliant units. These trackers utilize low-power wide-area networks (LPWAN) to ping their location to the central dispatch software once a day. If a unit moves outside its designated geographic geofence without an active transport work order, the system instantly alerts the fleet manager and provides real-time tracking coordinates to assist law enforcement in recovery, virtually eliminating total asset loss due to theft.